
Business Aviation Weather: Intro to SIGWX Charts
Significant Weather (SIGWX) charts provide invaluable meteorological information to business aircraft operators and flight crew. Particularly for longer flights, or when weather issues may be a factor, SIGWX charts can be a vital flight planning tool.
Here is an overview of what you need to know:
Know what SIGWX stands for
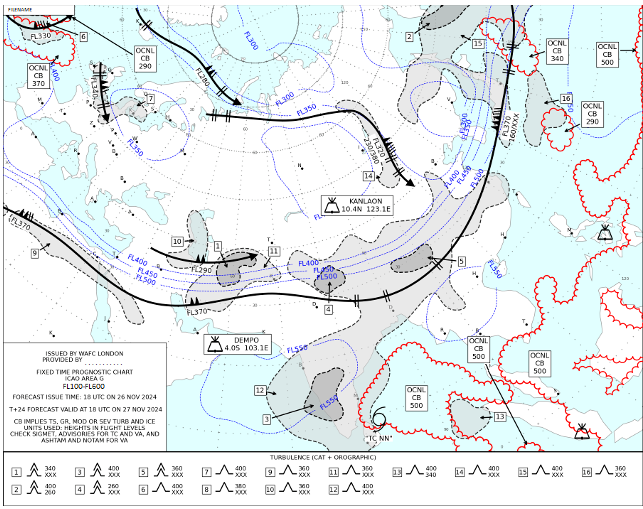
Significant Weather – or SIGWX – is a high-level chart indicating forecast position of jet streams, tropopause heights, thunderstorms/Cumulonimbus (CBS), turbulence, and fronts.
HIGH SIGWX charts are issued and updated throughout the day
SIGWX charts are issued four times a day: at 00, 06, 12, and 18Z. Two International Civil Aviation Organization (ICAO)-sponsored World Aviation Forecast Centers (WAFCs) – one in the US and the other in the UK – are responsible for issuing worldwide SIGWX charts. These are referred to as the Washington WAFC and London WAFC, respectively.
Know what HIGH SIGWX charts are available
High-level SIGWX charts provide world coverage between FL250 and 630.
Mid-level charts cover FL100-450 for the North Atlantic region. Additionally, the National Weather Service (NWS) issues surface Prognostics (PROGS) for the continental U.S. and Hawaii. NWS Alaska issues surface PROGS for Alaska.
Nav Canada provides PROGS for Canada.
Know how SIGWX information is gathered
Forecasters use model data and pilot reports, as well as satellite imagery, to produce SIGWX charts. Tropical cyclone information is gathered from Tropical Cyclone Advisory Centers (TCACs). Meanwhile, volcanic information is derived from Volcanic Ash Advisory Centers (VAACS) on the location of volcanic eruptions producing ash clouds of significance to aircraft operations.
Assorted information is provided on SIGWX charts
SIGWX charts provide surface frontal positions/jet streams (direction, depth, and max speed); upper and surface high and low tropopause heights; thunderstorm/CBS coverage and tops; turbulence (moderate or severe) in cloud or clear air (with base and tops); moderate or severe icing (base and top); and indications of widespread sandstorms, dust storms, volcanic ash, or radioactive materials.
Know how flight levels are indicated on charts
SIGWX charts indicate weather activity in increments of thousands of feet. FL340, for example, indicates 34,000 feet. Low-level charts should be used by aircraft flying from the surface to FL240. High-level SIGWX charts are used by aircraft flying FL250 and above.
Know the symbol indications for different weather
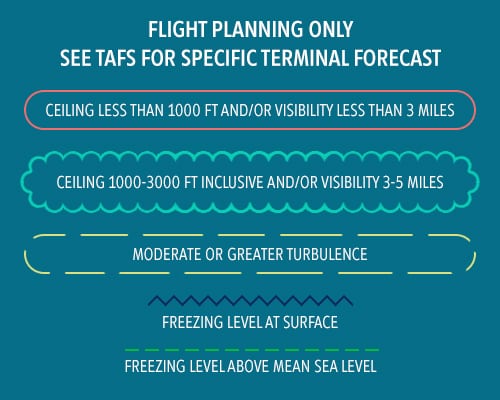
Symbols used on SIGWX charts are generally the same and are standard for aviation. The following link provides documentation on symbols used on SIGWX charts:
PROGS are issues for different forecast periods
36- and 48-hour PROGS are surface-based outlooks issued for general public use. 12-24 hour PROGS are produced by the NWS for aviation use and include low-level hazards such as marginal visual flight rules (MVFR)/instrument flight rules (IFR), turbulence, and freezing levels.
Aviation weather packages should always include SIGWX
SIGWX charts provide an accurate visual presentation of what weather hazards an aircrew can expect to encounter while en route. This is an important planning element for most flights.
Use these websites for information on NOAA GFA (Graphical Forecasts for Aviation)
- NOAA GFA Help including Products, Tutorial, Symbols, and FAQ: https://aviationweather.gov/gfa/help/
- NOAA GFA Worldwide Interactive Map: https://aviationweather.gov/gfa/#turb
Custom SIGWX charts are available
Some 3rd-party providers produce their own graphics packages tailored to the specific needs of aviation or particular operator requirements. These may provide additional graphical data concerning jet stream and thunderstorm/CBS coverage. Flight level depth of the jet stream on custom SIGWX charts may indicate base and top of 80 knot winds, depicted under the flight level of the maximum wind speed. Thunderstorm/CBS coverage is often broken down into the following:
ISOL less than 1/8 coverage; OCNL 1/8 to 4/8 coverage; FREQ 5/8 or greater.
If you are an N-registered Part 135, 91K, or 121 operator using a 3rd-party provider for enhanced weather data, make sure you understand recent regulatory changes governing establishment of an Enhanced Weather Information System (EWINS).
Additional tips regarding SIGWX
Always use charts that are valid to the nearest midpoint of your flight. For exceptionally long legs, two charts may be required, or updated, and PROGS may also be needed.
Conclusion
When working with your 3rd-party provider, always specify your requirements and preferences in terms of SIGWX charts. Additional considerations and charts may be required for longer-stage operations, and you may want to consider custom-formatted SIGWX charts, if they are available from your service provider.